
Imagine two models forecasting the return of some asset. The first gets the direction right 58% of the time. The second predicts zero every time, so it never predicts a direction at all.
If you trade on the sign of the forecast, the first model has positive expected profit before costs and the second never places a trade. Yet the default loss functions for training and ranking return models, such as a mean squared error, give the second model the lower loss.
This simulated example comes from a new paper led by Joel Pfeffer, with the Allora Research team. In this paper, we propose a loss function for return prediction called CZAR (Composite Zero-Agnostic Return).
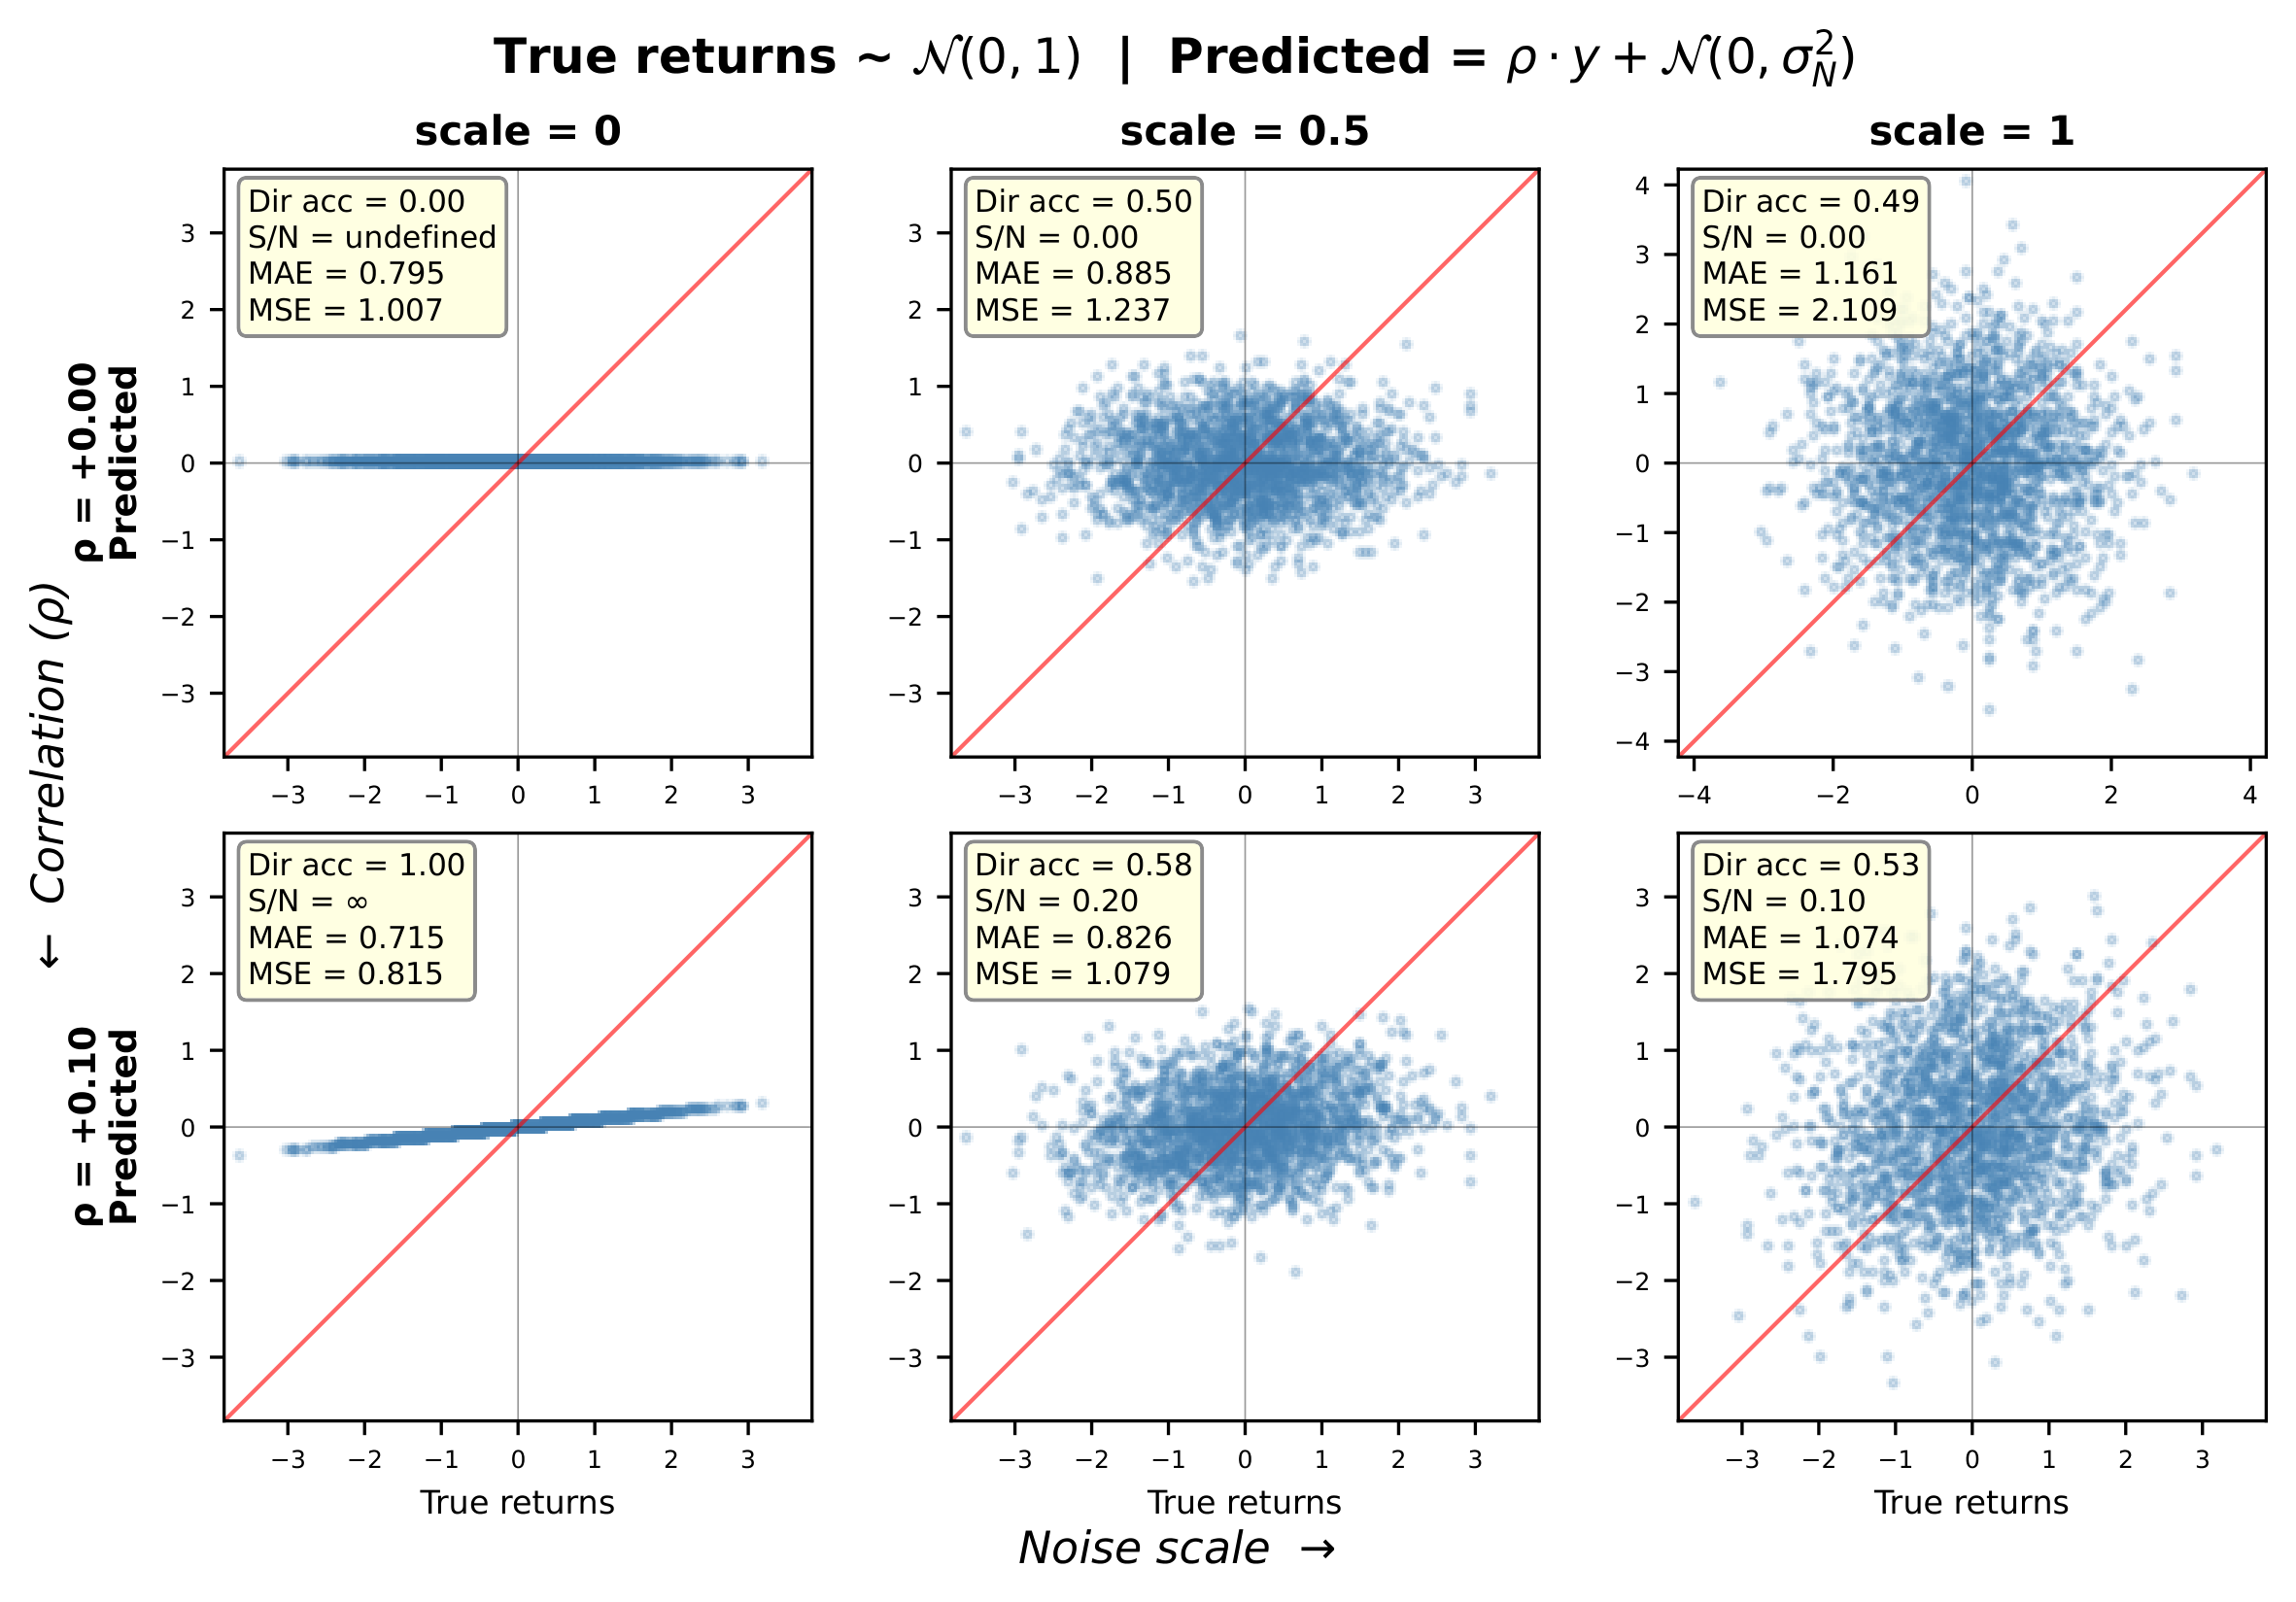
Predicting zero beats 58% directional accuracy under MAE and MSE. Six models of the same simulated returns. The top-left one predicts zero everywhere and gets no direction right, yet its MAE (0.795) and MSE (1.007) are lower than those of the bottom-middle model, which gets the direction right 58% of the time (MAE 0.826, MSE 1.079).
The zero-returns bias
Log-returns have a conditional mean close to zero: given everything a model can know, the expected return is very small. Symmetric losses like MSE and MAE are minimized by that conditional mean (or the median), so a constant forecast of zero is already close to optimal. A model with directional skill also makes noisy predictions, and with realistic levels of noise a symmetric loss penalizes that noise more than it rewards the signal.
In training, the gradient of the loss determines what the model learns, and the signal available in returns is small (published out-of-sample R² values for machine-learning return models, for example by Gu, Kelly and Xiu in 2020, are a few percent at most). A model trained on MSE tends to respond by shrinking its predictions toward zero. The training loss goes down, but the forecast loses its value as a directional signal.
Model selection has the same problem. Sample-averaged losses decide which hyperparameters you keep, when training stops and which model gets deployed, so a loss that scores the constant forecast well biases each of those choices toward models with tiny predictions.
We call this the zero-returns bias. In a simple Gaussian model of returns and predictions, we show that every symmetric loss that grows with the size of the error (MSE, MAE and Huber included) shares one breakeven curve, which gives the directional accuracy a model needs to tie with the zero forecast.
The breakeven accuracy rises steeply as the noise in the predictions approaches the volatility of the returns, and once the two are equal, no directional accuracy is high enough.
Why the standard alternatives fall short
The best known asymmetric losses are the pinball loss of quantile regression and its squared counterpart in expectile regression, which penalize overprediction and underprediction by different amounts. In these losses the asymmetry is set by the sign of the error, so the same direction of error is favored at every true return.
That shifts the optimum from the mean to a fixed quantile or expectile: a uniform bias that applies even when the true return is zero and there's no direction to prefer.
A constant asymmetry strong enough to materially lower the breakeven accuracy creates a second problem. When models are ranked by the mean of the log of their losses (equivalently the geometric mean, which limits how much a few large errors can dominate the average), the breakeven accuracy can fall below 50%. A model that's systematically wrong about direction then outranks the zero forecast.
Training directly on an economic objective such as the Sharpe ratio (average return divided by its volatility), as Moody and Saffell did in 2001, improves trading-relevant performance. But those objectives are typically non-convex, tied to one portfolio construction, or lack the analytical gradient and Hessian that LightGBM and XGBoost need for a custom objective.
Asymmetry set by the direction of the move
Suppose BTC moves up by 2 standard deviations. One model predicts +4 standard deviations and another predicts 0. Both miss by 2, so MSE and MAE give them identical losses.
The first model got the direction right and overestimated the size of the move, while the second gave no directional information at all. At the default setting, CZAR gives the first prediction a loss of about 0.07 and the second a loss of about 4.
The asymmetry scales with the size of the true move. When the true return is zero there's no direction to get right, so CZAR is symmetric there.
From the analysis above, we derived 5 requirements. A loss for return prediction should:
- be convex in the prediction, so it works as a custom objective in gradient-boosted libraries;
- be asymmetric according to the direction of the true return, and symmetric when that return is zero;
- penalize undershoots and wrong-direction calls close to linearly, because under plain averaging a linear penalty lowers the breakeven accuracy much more than a quadratic one;
- keep growing for large errors, so outliers still count;
- include an adaptive loss floor for evaluation (explained below).
CZAR combines a linear and a quadratic penalty for undershoots and wrong-direction calls with a discounted quadratic penalty for overshoots, and the discount grows with the size of the true move.
We prove that it's convex in the prediction. Its gradient and Hessian are closed-form, and in practice its 4 hyperparameters reduce to a single choice through default relations between them. The paper includes a NumPy reference implementation.
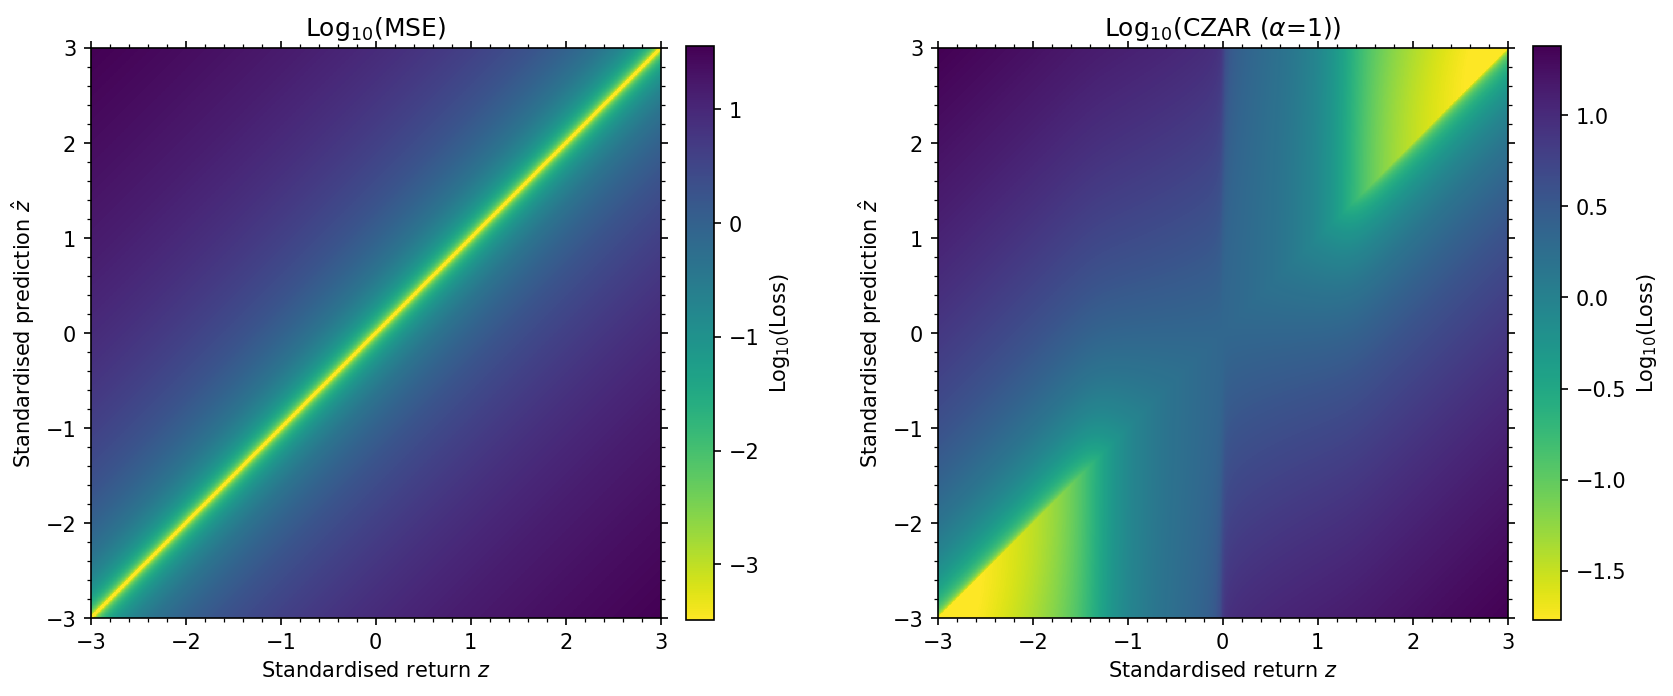
Loss maps for MSE and CZAR. Loss on a log scale as a function of the true return (horizontal axis) and the prediction (vertical axis), both in units of volatility. Yellow is low loss, and the two color scales differ. MSE (left) depends only on the distance from the diagonal. CZAR (right) gives a low loss to correct-direction overshoots of large moves (the yellow wedges) and a high loss to wrong-direction calls (top left and bottom right). For true returns near zero, the loss floor sets a minimum loss even for a perfect prediction.
A floor for evaluation
Many samples in a return series are small moves relative to recent volatility, and a zero forecast gets a tiny loss on each of them. When losses are log-averaged, the logarithm of a tiny loss is a large negative number, so those samples lower the average substantially and make the zero forecast look better than it is.
CZAR adds a floor: when the true return is near zero, the loss has a minimum level whatever the prediction, and that minimum decreases as the move gets larger. A zero forecast can no longer score near-zero losses on the many samples where the price barely moves.
The floor level is also tuned so that, in the Gaussian test, the breakeven accuracy stays at or above 50%, so a wrong-direction model can't outrank the zero forecast either.
The floor doesn't depend on the prediction, so it has no gradient and only matters in log-averaged evaluation: ranking, hyperparameter tuning and early stopping. Under a plain average it adds the same amount to every model on the same data.
Does it work?
In the Gaussian test setup with log-averaged evaluation, CZAR's breakeven accuracy is within a few percentage points of the 50% chance level at every noise level we tested, up to 1.5 times the return volatility. For symmetric losses that grow with the error, the breakeven accuracy diverges when the noise equals the volatility.
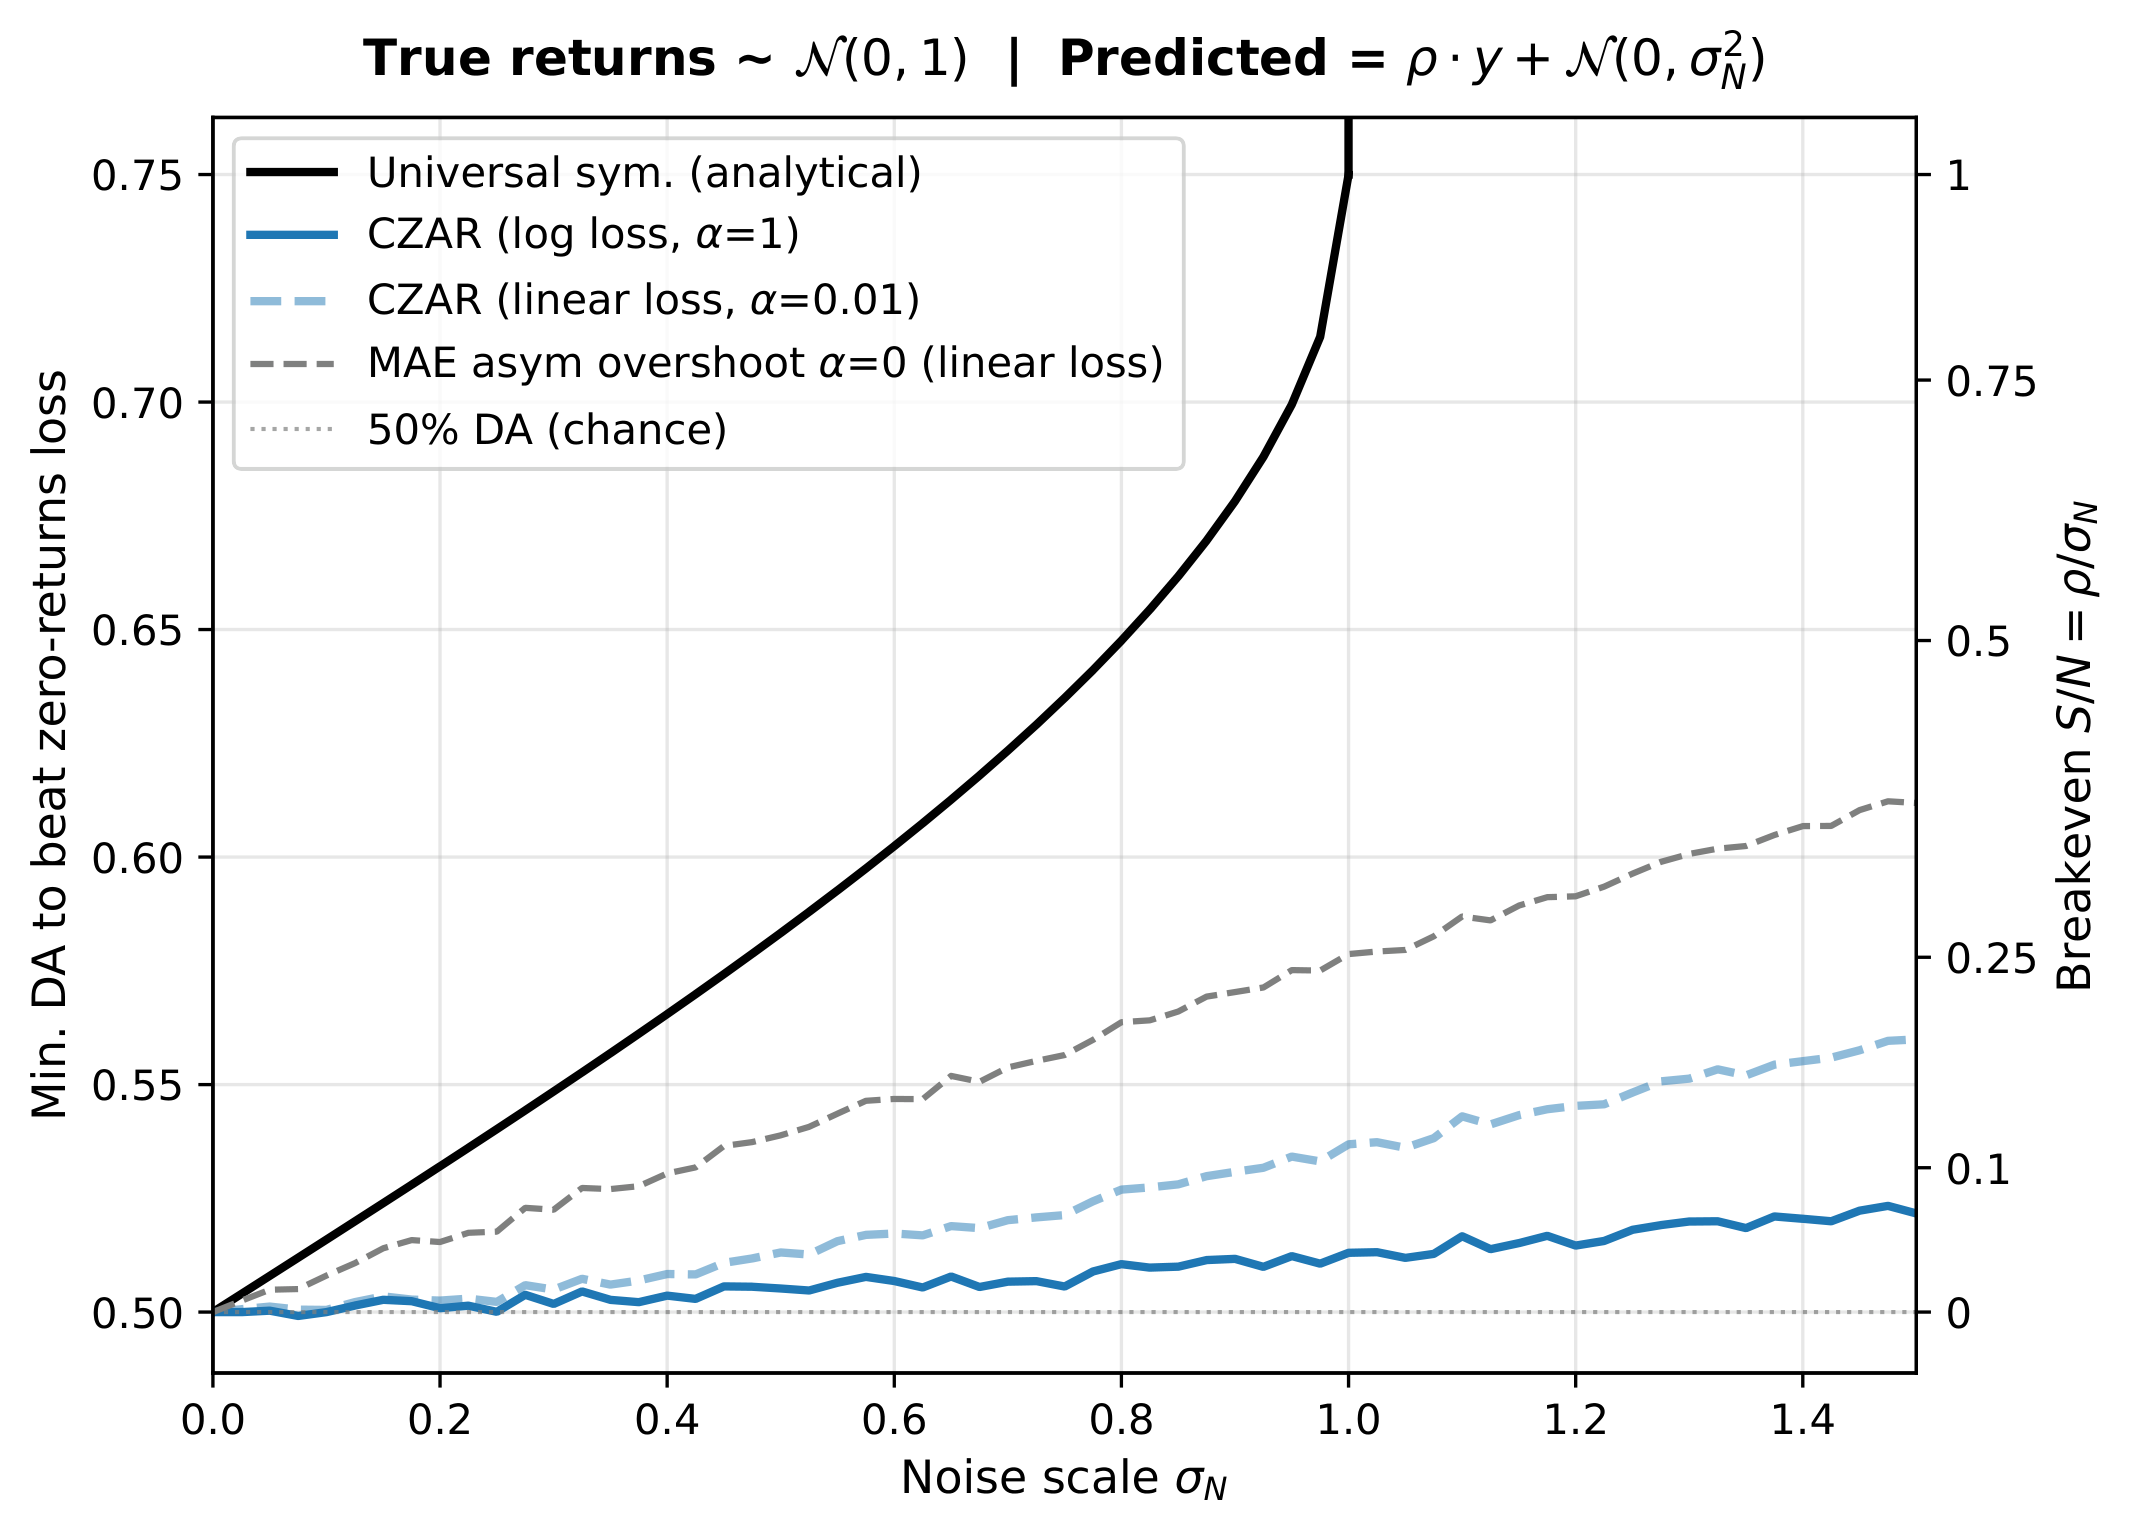
Directional accuracy needed to beat the zero forecast. Results for the Gaussian test, with prediction noise in units of return volatility on the horizontal axis. All symmetric losses that grow with the error share the black curve. CZAR with log-averaged evaluation is dark blue; the dashed lines show plain averaging, for CZAR (light blue) and for an asymmetric MAE that ignores overshoots (gray).
Actual returns have heavier tails than a Gaussian, so we repeated the test with Student-t distributions, which put more weight on extreme moves, at tail indices of 5 and 3 (the second is a stress test with infinite kurtosis). With log-averaged evaluation, heavier tails raise the breakeven accuracy for both CZAR and MSE, and CZAR's is still lower than MSE's at every noise level we tested. With plain averaging, the tails barely change either loss's curve.
Across a broad range of signal and noise levels in the simulation, noisy models with 60 to 70% directional accuracy rank below the zero forecast under MSE, MAE and Huber (a hybrid of the two) when losses are log-averaged. Under those losses, a model can also lower its loss just by shrinking its predictions. Under CZAR, those models rank above the zero forecast and the wrong-direction ones stay below it.
For weak to moderate signal, a model's CZAR loss barely changes with its noise level, so its rank depends on its signal, and shrinking its predictions doesn't improve that rank.
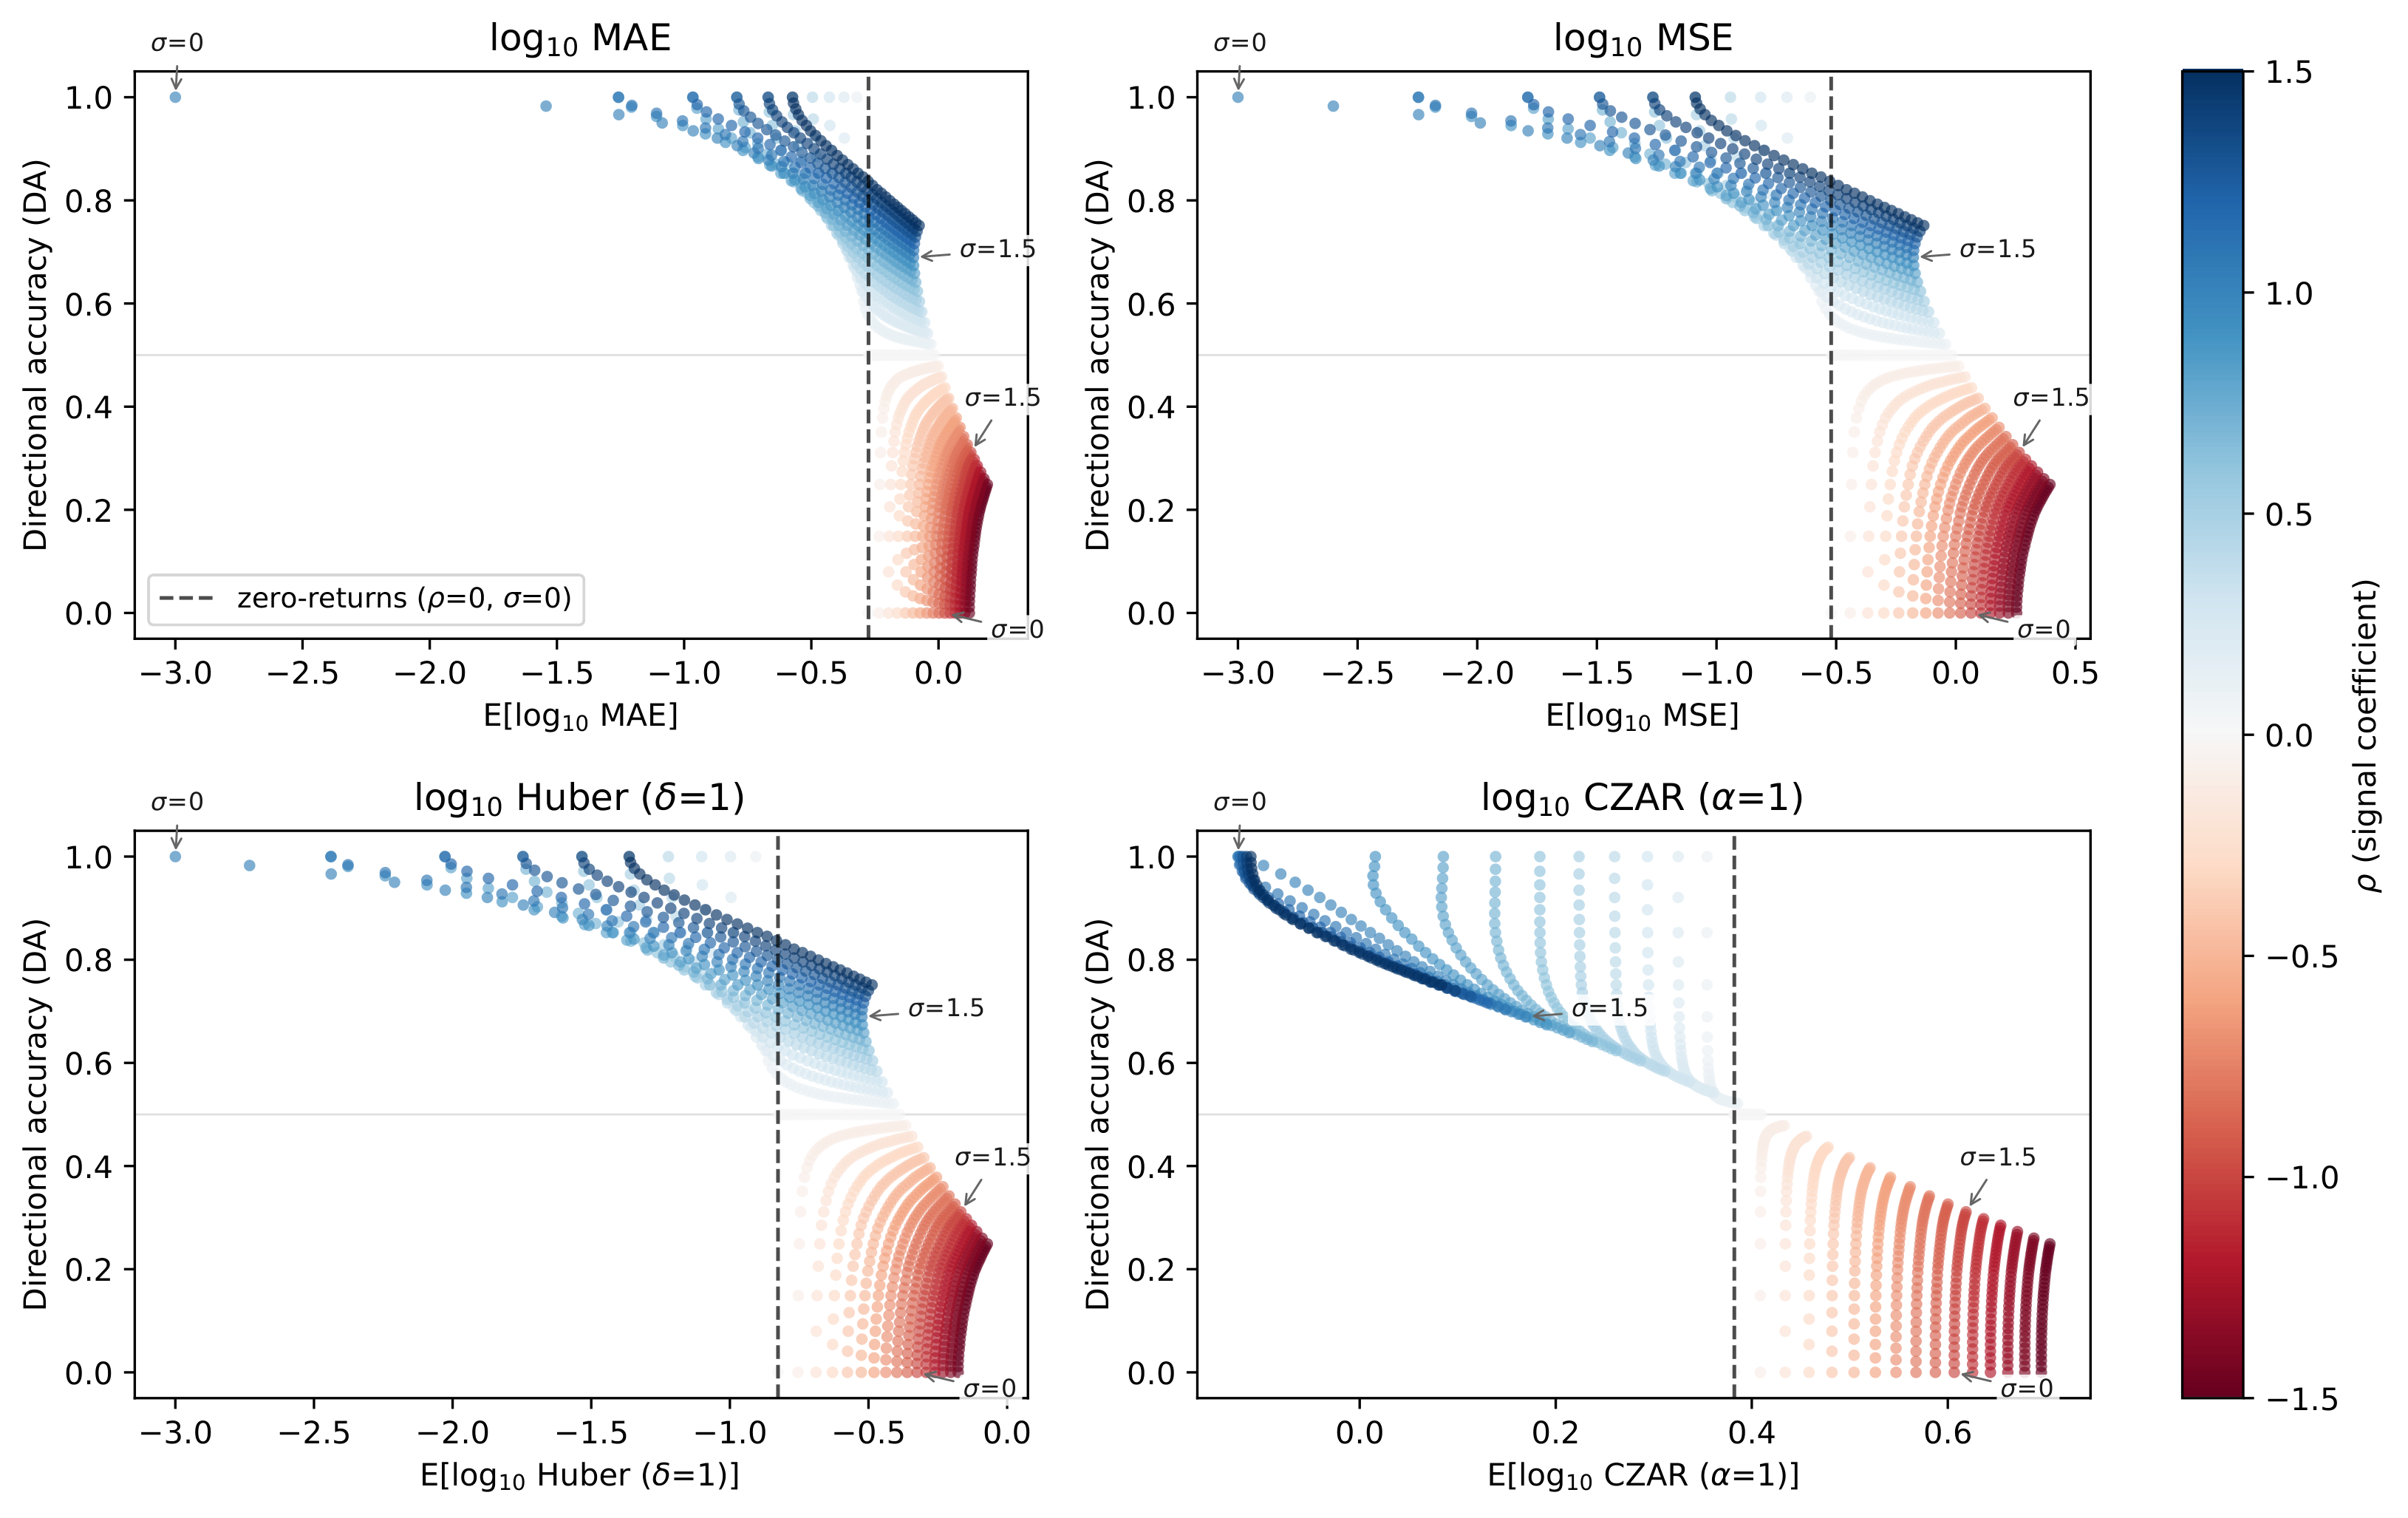
Log-averaged loss versus directional accuracy. Each point is one simulated model, colored by its signal: blue models are right about direction on average, red ones are wrong. Points left of the dashed line beat the zero forecast. Under MAE, MSE and Huber, the noisy blue models with 60 to 70% accuracy are right of the dashed line. Under CZAR, those blue models are left of it and the red ones remain right of it. The pale vertical columns in the CZAR panel are weak-signal models whose loss barely changes as their noise changes.
For real data, we trained LightGBM on BTC log-returns at 15-minute and 1-hour horizons, with a deliberately basic feature set and every loss tuned independently, and compared CZAR with L1 and L2 (MAE and MSE) on 2,000 held-out candles.
The L1 and L2 models show the shrinkage the theory predicts. The spread of their predictions is only 7 to 12% of the spread of the realized returns, and their directional accuracy on moves larger than 1 standard deviation is between 47 and 50%, no better than chance.
With CZAR, the spread of the predictions is 15 to 40% of the realized spread, depending on the setting, and directional accuracy on those large moves is 50 to 56%. Only about a third of the test candles are large moves, so each of these accuracies has a standard error of about 2 percentage points.
Individual accuracies are noisy, but at both horizons every CZAR setting has a higher directional accuracy on large moves than both L1 and L2. The correlation between predictions and realized returns is generally higher too.
A naive Sharpe ratio for a long-short strategy that trades the sign of the prediction is higher than for both L1 and L2 at every CZAR setting on the 1-hour horizon, and at all but one on the 15-minute horizon. The calculation is naive on purpose (sign-only, always in the market, no transaction costs, annualized from test windows of 21 and 83 days), and with windows that short any single Sharpe difference is noisy. We make no claim about live trading performance.
Full-sample directional accuracy changes little. With 2,000 test candles its standard error is about 1 percentage point, and most differences are within that. The gains appear on the large moves, which typically account for most of the profit and loss of a directional strategy.
The BTC experiment covers one asset, one train-test split per horizon and a basic feature set, so it should be read as one controlled comparison.
At the 15-minute horizon, we then took the CZAR-trained models and ran their hyperparameter tuning and early stopping on a symmetric validation loss (log-averaged L1) instead. The training gradients were identical, and only the selection criterion changed.
The predictions shrank to the level of the L1 and L2 models, from roughly a quarter of the realized spread to a tenth or less, and directional accuracy on large moves fell back to about 50%.
In this experiment the gains depended on using CZAR for model selection as well as training: selecting CZAR-trained models with a symmetric loss can reintroduce the shrinkage.
Implications beyond CZAR
Symmetric losses conflate a model's directional skill with the spread of its predictions. You can lower your MSE by becoming more accurate or by shrinking your predictions toward zero, and the loss alone doesn't show which of the two happened.
Two recommendations from the paper apply to any loss. First, report the ratio between the spread of the predictions and the spread of the realized returns alongside any loss-based leaderboard. Second, treat the averaging convention (arithmetic or geometric mean of the losses) as part of the loss design, because an asymmetry that behaves well under one can lead to a breakeven accuracy below 50% under the other.
Forecasting competitions and production model selection that rank return forecasts on symmetric losses will tend to favor shrunken models over noisy but directionally informative ones.
CZAR comes at the cost of a deliberate forecast bias. Its optimum is shifted away from the conditional mean, so its outputs shouldn't be read as expected returns. We argue that's a good compromise when you monitize direction; if you need unbiased point forecasts, it probably isn't.
On the Allora Network, each prediction task (a "topic") has a loss that determines how rewards are split among the workers, who are scored on the logarithm of their losses, which is the setting where the loss floor matters. A symmetric loss on a return topic would tend to reward forecasts that stay close to zero, so every log-return topic on Allora is scored with CZAR.
The open-source Allora Forge Builder Kit also includes CZAR as a LightGBM objective, so workers can train with the same loss the network scores them with. Given the selection experiment above, it's probably worth selecting models with CZAR as well.
—
Interested in learning more? Read the full research paper in Allora Decentrized Intelligence or on the arXiv. Want to share your thoughts? Join the discussion on the Allora Research Forum. Want to participate in the Allora Forge? Get started with the Allora Forge Builder Kit.
About Allora Labs
Allora Labs is the main developing contributor to the Allora Network, a decentralized AI inference network. Allora Labs conducts research in swarm intelligence, model coordination, and inference synthesis.
About Allora Decentralized Intelligence
Allora Decentralized Intelligence (ADI) is a scholarly research journal publishing innovation in decentralized machine intelligence, model coordination, and swarm intelligence.

.png)
